Vix Volatility Explodes: Are You Ready for the Market Rollercoaster?
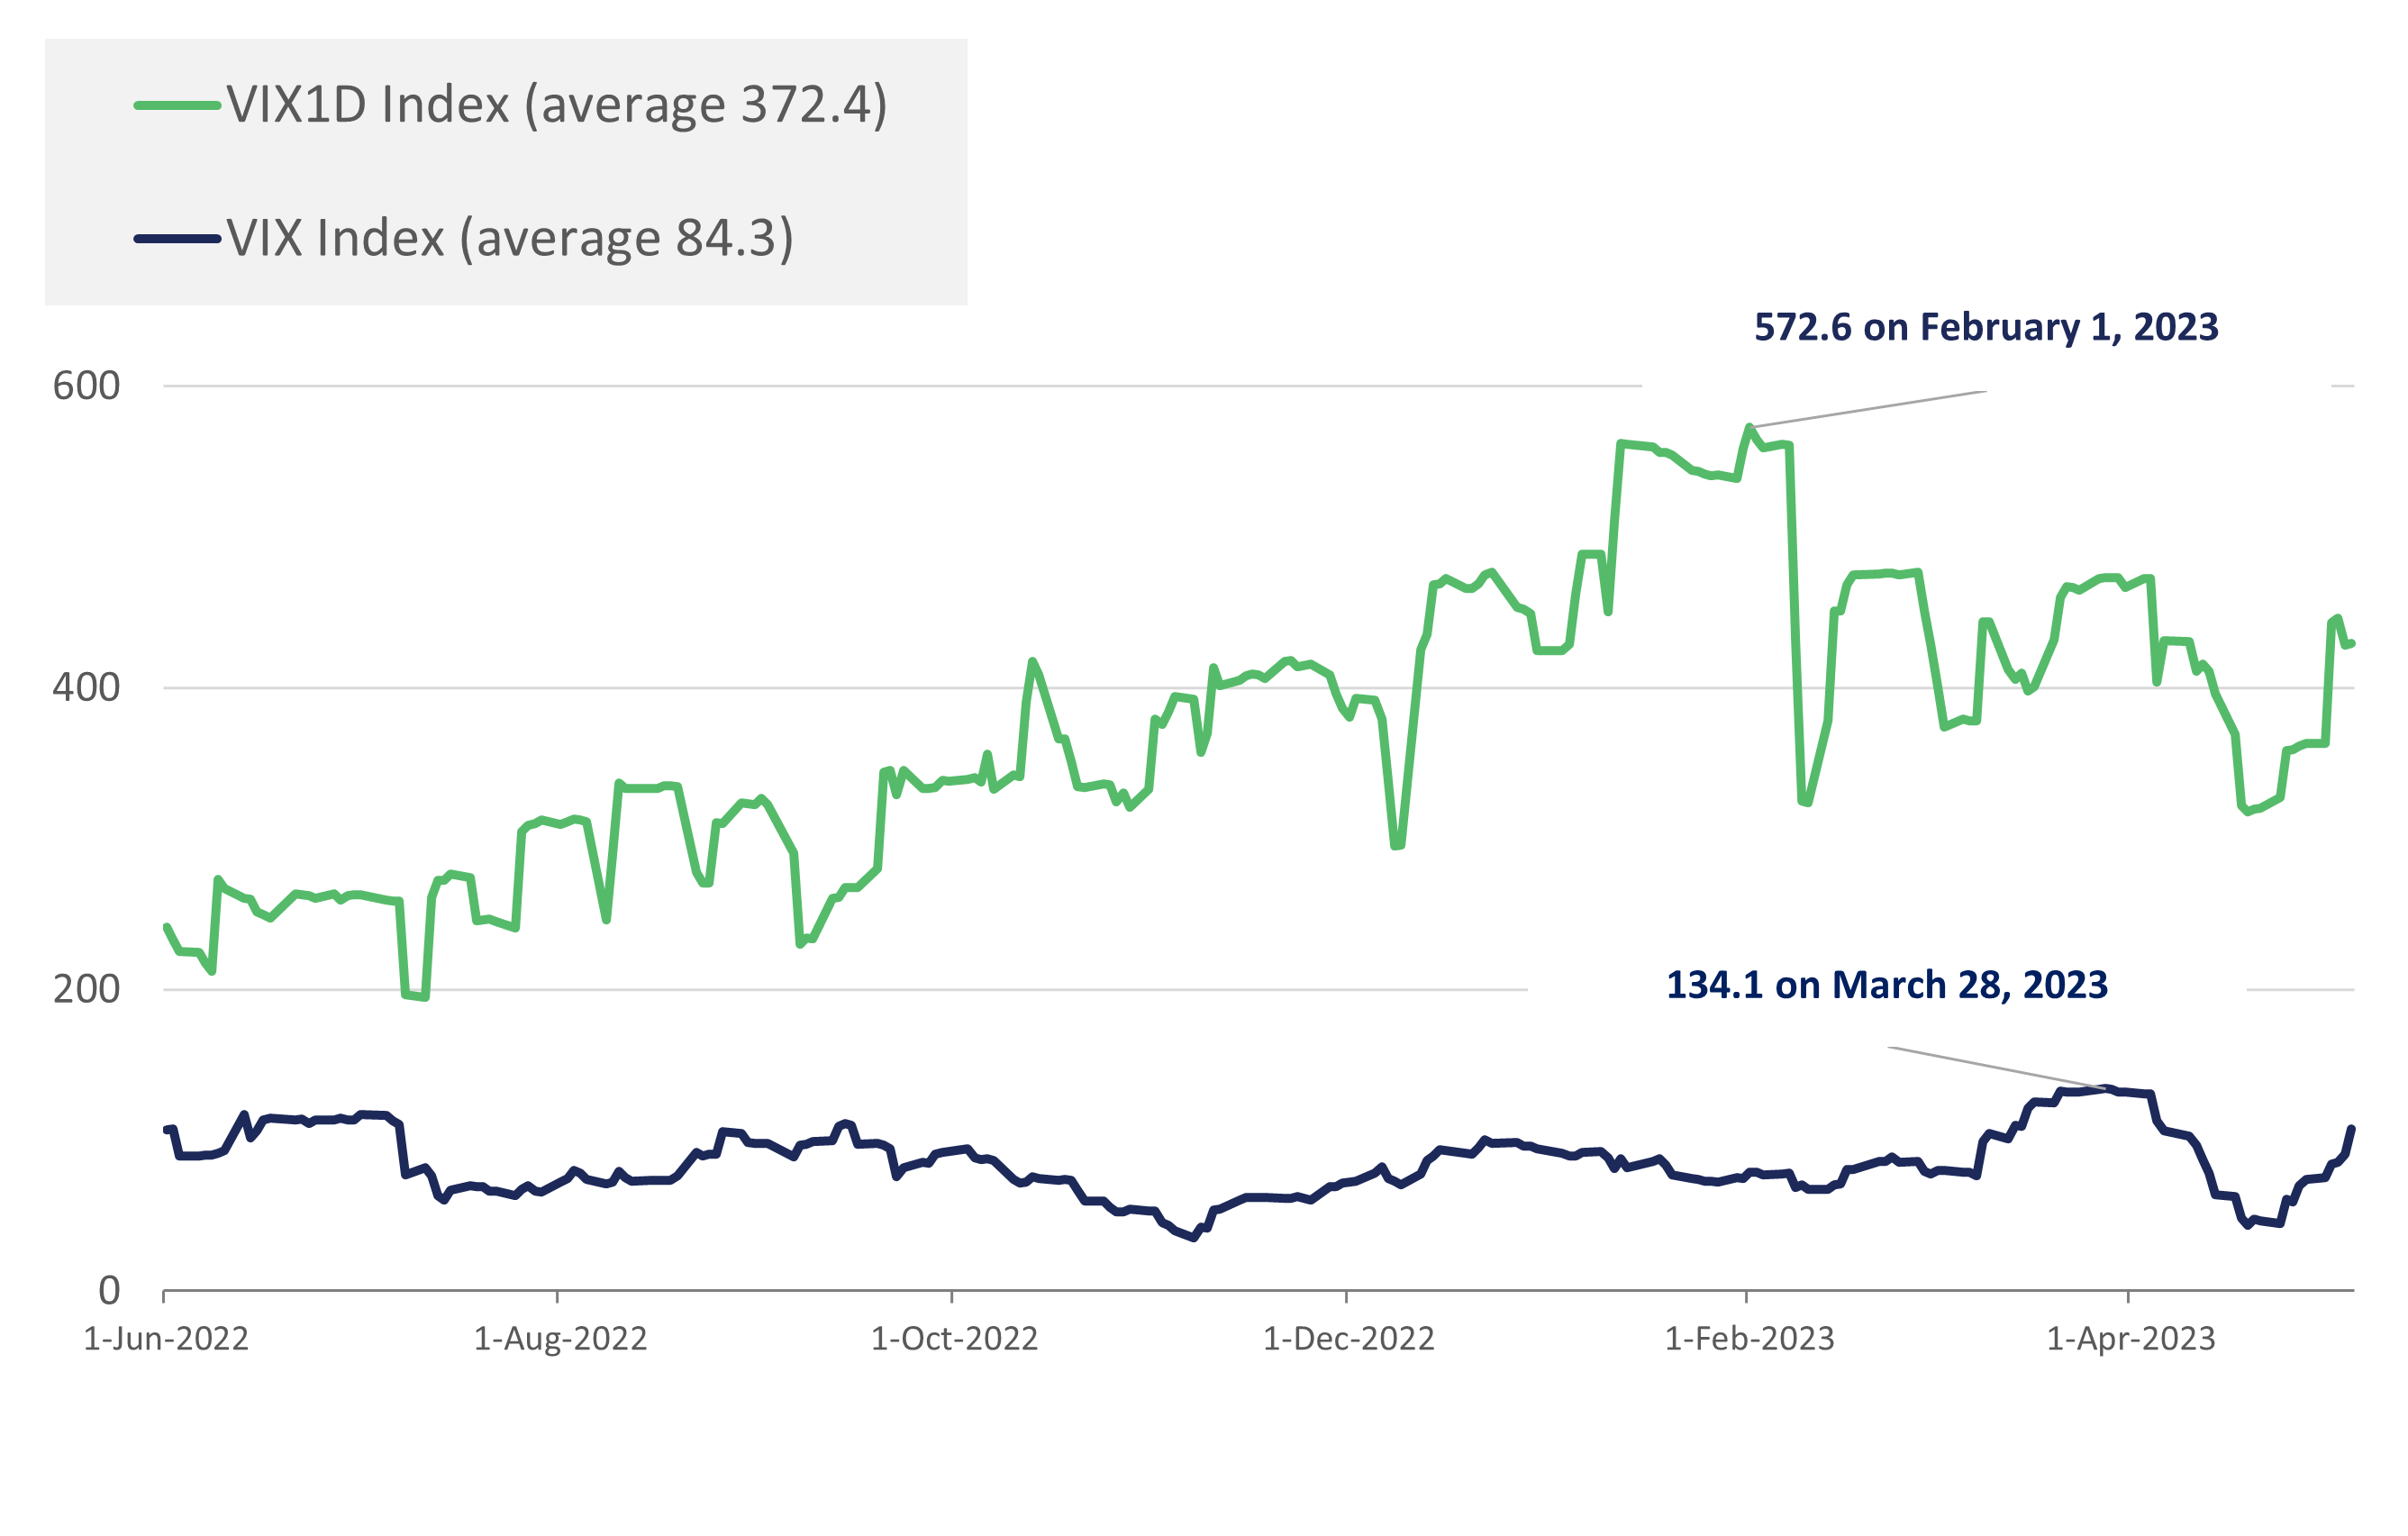
The CBOE Volatility Index, also known as the VIX, is often referred to as the "fear gauge" of the stock market. It measures the expected volatility of the S&P 500 Index over the next 30 days. As the name suggests, the VIX has been on the rise, indicating that investors are becoming increasingly anxious about the market's direction. In this article, we'll delve into the world of VIX volatility and explore what it means for investors, traders, and the overall market.
The VIX is calculated based on the prices of 30 S&P 500 Index options contracts that expire in two weeks. It's a widely followed indicator that has been shown to be a reliable predictor of market movements. Historically, a high VIX has signaled a potential market downturn, while a low VIX has indicated a bull market.
For investors, understanding the VIX is crucial in navigating the current market landscape. A rising VIX can indicate that investors are becoming more risk-averse, which may lead to a decline in stock prices. On the other hand, a declining VIX can signal a shift towards a more optimistic market outlook.
The Rise of VIX Volatility
The VIX has been steadily increasing over the past year, with some fluctuations along the way. As of now, it's hovering around the 40 level, which is roughly 20% above its historical average. This increase in volatility is driven by a combination of factors, including:
- Global economic uncertainty: The ongoing pandemic, trade tensions, and rising inflation have created an environment of uncertainty, leading to increased market volatility.
- Central bank policies: The unprecedented monetary policies implemented by central banks have led to a surge in market uncertainty, causing investors to become more cautious.
- Technical issues: Recent technical glitches in the stock market have also contributed to the rise in VIX volatility.
How to Read the VIX
Understanding the VIX requires a basic understanding of market indicators and risk management strategies. Here are some key points to keep in mind:
- The VIX is a forward-looking indicator: It's not a historical indicator, but rather a prediction of future market movements.
- The VIX is a relative measure: It's measured relative to the S&P 500 Index, so a high VIX doesn't necessarily mean a high market risk.
- The VIX has a inverse correlation with the S&P 500: A high VIX typically indicates a low S&P 500 Index, and vice versa.
Are You Ready for the Market Rollercoaster?
As the VIX continues to rise, investors and traders need to be prepared for a potential market downturn. Here are some strategies to consider:
- Diversification: Spread your investments across different asset classes to minimize risk.
- Risk management: Set stop-loss orders and limit your position sizes to prevent significant losses.
- Stay informed: Continuously monitor market news and developments to stay ahead of the curve.
VIX Volatility vs. Market Direction
There's a common misconception that a high VIX always means a market downturn. While it's true that a high VIX can indicate increased market volatility, it's not a direct predictor of market direction. In fact, a high VIX can also be a sign of a potential short-term market rally.
Here are some scenarios to consider:
- Bear market: A high VIX can indicate a bear market, but it's not the only factor. Other technical and fundamental indicators need to be considered.
- Bull market: A low VIX can signal a bull market, but it's not a guarantee. Other market indicators need to be analyzed before making investment decisions.
Measuring VIX Volatility
To better understand the VIX, it's essential to measure its volatility. Here are some key metrics to consider:
- VIX historical volatility: Measure the historical volatility of the VIX over a specific period to determine its overall trend.
- VIX realized volatility: Measure the actual volatility of the VIX over a specific period to determine its current level.
- VIX expected volatility: Measure the expected volatility of the VIX over a specific period to determine its future outlook.
Conclusion
The VIX has been on a rollercoaster ride, and investors and traders need to be prepared for the market volatility ahead. By understanding the VIX, its historical context, and market indicators, investors can navigate the current market landscape with confidence. Whether you're a seasoned investor or a newcomer to the world of finance, the VIX is an essential tool to help you make informed investment decisions.
Whether you're ready for the market rollercoaster is a topic of ongoing debate. One thing is certain, however: the VIX will continue to play a significant role in shaping market trends and investor sentiment. Stay informed, stay vigilant, and be prepared to adapt to the ever-changing market landscape.
Recent Post
Unlocking The Secrets Of Menopause: Expert Insights On Navigating Life After 40 With Paolo Tantoco
Tensions Rise As Trump Officials Defend Tariffs Amid Market Volatility And Warnings For Savers And Retirees
Rosie O'Donnell Teases Trump Move, Posts Disruptive Selfie From Abroad
Wings For The Win: Capitals Edge Ducks 7-4 In Thrilling Matchup
Ducks Fall Short: Key Takeaways From Thrilling 7-4 Loss To Capitals
Article Recommendations
- Matthew Gray Gubler's Relationship Status: Is The Criminal Minds Star Single Or Taken?
- Unveiling The Secrets Of Sam Frank's Captivating Fandom
- Hopie Carlson: Embracing Adventure And Inspiring Others To Live Life On Their Terms